
It's sometimes helpful to debug a webpage rendered in a webview in order to inspect its layout or to troubleshoot JavaScript. Fortunately, it's easy to remotely inspect webviews that are running in your Android or iOS application. This entails connecting your Android or iOS device to your dev computer and then using your browser's developer tools to inspect your app's webviews.
Debugging Android webviews
One way to troubleshoot JavaScript on Android is to insert console.log() statements into your code, since those messages are printed to the Logcat logs that are viewable in Android Studio. However, it's often much more helpful to inspect the page with Chrome DevTools, because that allows you to use its JavaScript debugger and other essential tools. To do that, just follow these steps:
- First, enable USB debugging on your Android device. If you use the device for development, then you've probably done this already.
- Install Chrome on your dev computer if you haven't yet.
- Connect your Android device to your dev computer and launch your application.
- Launch Chrome on your dev computer and navigate to the url
chrome://inspect. This page shows you a list of webview instances running on your connected Android device.
- Click the inspect link next to the webview that you wish to debug. This will open a new Chrome DevTools window for inspecting the webview.

Debugging iOS webviews
In iOS webviews, messages passed to console.log() are not printed to the Xcode logs. It's still relatively easy to debug web content with Safari's developer tools, although there are a couple of limitations:
- Debugging iOS webviews requires Safari, so your dev computer must be running macOS.
- You can only debug webviews in applications loaded onto your device through Xcode. You can't debug webviews in apps installed through the App Store or Apple Configurator.
With those limitations in mind, here are the steps to remotely debug a webview in iOS:
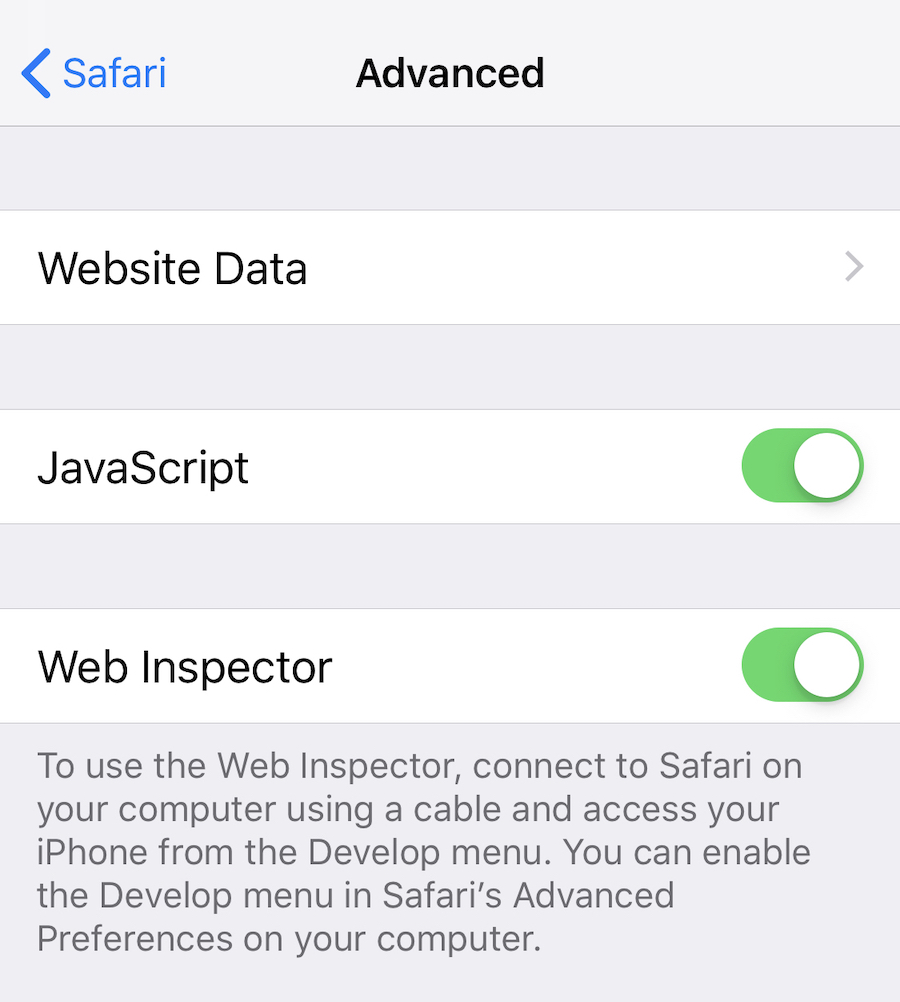
- First, enable the Safari Web Inspector on your iOS device by opening the iOS Settings app, navigating to Settings > Safari > Advanced, and toggling the Web Inspector option on.
- Next, you must also enable developer tools in Safari on your dev computer. Launch Safari on your dev machine and navigate to Safari > Preferences in the menu bar. In the preferences pane that appears, click on the Advanced tab and then enable the Show Develop menu option at the bottom. After you do that, you can close the preferences pane.

- Connect your iOS device to your dev computer and launch your app.
- In Safari on your dev computer, click on Develop in the menu bar and hover over the dropdown option that is your iOS device's name to show a list of webview instances running on your iOS device.

- Click the dropdown option for the webview that you wish to debug. This will open a new Safari Web Inspector window for inspecting the webview.
